Technical analysis of stocks is an approach to evaluating securities that involves analyzing market activity statistics like past prices and volumes. Technical analysis is based on the idea that market dynamics, as shown by charts and some other technical indicators, could predict future activity. Charts and other methods are used by technical analysts to identify patterns and make investment choices.
Technical analysis of stocks is really a trading practice that employs trends and patterns obtained from market activity, such as price action and volume, to evaluate investments but rather identify trading strategies. Apart from fundamental analysis, which aims to assess a security’s value based on the corporate result obtained such as revenue and earnings.
Fundamental Analysis V/S Technical Analysis
Fundamental analysis is a way of evaluating securities that attempts to calculate a stock’s intrinsic value. Fundamental analysts research everything from the overall economy and industry dynamics to a company’s financial condition and management. Revenues, expenditures, investments, and debts are all crucial to fundamental analysis.
Technical analysis of stocks differs from fundamental analysis because the only inputs are the stock price and volume. The fundamental assumption is that all known fundamentals are priced in, so there is no need to pay particular attention to them. Analysts do not attempt to calculate a security’s intrinsic value, but rather use stock charts to recognize trends and patterns that indicate how a stock will perform in the future.
Fundamental analysis is a method of evaluating securities that attempts to calculate a stock’s intrinsic value. The core assumption of technical indicators, on the other hand, is that all known fundamentals are factored into the price and thus do not require close attention. Technical analysts do not try to calculate a security’s intrinsic value; instead, they use charts to recognize trends and patterns that may indicate how the security will perform in the future.
Why Technical analysis of stocks?
Help you choose between the three options at any given time:
1. Create a new position
2. Exit a position
3. Take no action
What are the 4 basics of technical analysis?
Introduction to Technical analysis of stocks attempts to identify trading opportunities and identify entry and exit points based on price and volume data. The four core parts of technical analysis are as follows.
Trend Analysis: entails determining the overall trend of the economy, whether up, down, or sideways, and then determining whether a specific security is moving in a similar direction.
Chart Analysis: Technical analysts frequently use charts and graphs to visualize market trends and recognize potential trading opportunities. This includes the use of chart patterns like the head and shoulders, triangles, and flags.
Indicator Analysis: Indicators are numerical calculations based on a security’s price and/or volume. Indicators include moving averages, momentum indicators, and oscillators used by technical analysts to help identify potential trading signals and trends.
Volume analysis means analyzing the trading volumes in security to help verify trend direction and market strength. Volume indicators can also help technical analysts spot possible trend reversals.
Technical analysts use these four basic elements to make trading decisions based on previous market data and also to forecast future trends in markets.
Using Technical analysis
Professional analysts frequently combine technical charts with other types of research. Retail traders may base their decisions solely on a security’s price charts and similar statistics, but practicing equity analysts rarely confine their research to fundamental or technical analysis alone.
Technical analysts believe that any security with historical trading data can be subjected to technical analysis tools. This includes stocks, futures, commodities, fixed-income securities, currencies, and other financial instruments. Indeed, analysis is far more common in commodities and forex markets, where traders are concerned with short-term price movements rather than the future price.
What is Dow theory?
Charles H. Dow, the co-founder of Dow Jones & Company and The Wall Street Journal, developed Dow Theory, a market analysis approach. It is regarded as one of the first forms of technical analysis, and it gives a framework for comprehending market patterns and making financial decisions.
While the stock market and the economy have changed dramatically since the theory’s inception, its principles are still widely employed by technical analysts today. Nowadays, the technical analysis includes hundreds of patterns and signals developed over many years of research.
Fundamental assumptions of Dow Theory
Dow Theory’s fundamental assumptions are as follows:
Dow Theory holds that the stock price discounts everything publicly available information, including economic, political, and financial data, in the prices of securities. This means that the market reflects all market participants’ collective opinions and expectations and that stock prices will move in anticipation of future events.
There are three market trends: Dow Theory holds that there are three distinct trends in the stock market: primary, secondary, and minor.
- The primary trend reflects the market’s overall direction and is regarded as the most important.
- Secondary trends are intermediate fluctuations in the primary trend, whereas minor trends are market fluctuations that last only a few days.
Volume Confirms Price Movement: According to Dow Theory, volume is an important tool for confirming the validity of market price move. Increased volume during an uptrend indicates market strength, while increased volume during a downward trend indicates market weakness.
These Dow Theory fundamental assumptions provide a framework for understanding market trends and making investment decisions based on publicly available data.
What is a Trend?
Trend: An upper trend is a series of
successively higher peaks and troughs; a
the downtrend is just the opposite, while
horizontal peaks and troughs would identify a
sideways price trend (trendless).
Remark: It is the direction of those peaks and
troughs that constitute a market trend.
What Are Technical Analysts’ Assumptions?
Professional technical managers typically accept three broad assumptions about their field. The first is that the market, such as the efficient market hypothesis, discounts everything. Second, they anticipate that price levels, even in random market volatility, will exhibit trend lines regardless of the time frame. Finally, they believe that history has a habit of repeating itself. The repetitive nature of price changes is attributed largely to market psychology, which is based on emotions such as fear or excitement.
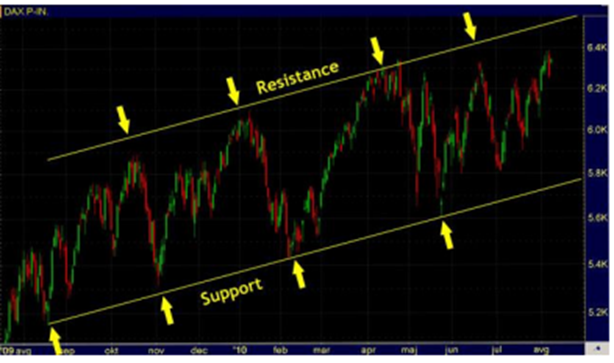
What is meant by Support and Resistance? How can they be used to determine trends?
Support is a level or area on the chart beneath the market levels where buying interest is sufficiently strong to overcome selling pressure, halting the decline and causing prices to rise again.
A level or area of the market where selling pressure overcomes buying pressure and a price advance is reversed is called Resistance.
Tested support and resistance are more reliable.
All of the indicators and tools are designed to assist you in two ways:
1. Determine the strength of potential supports and barriers.
2. Determine the current probability of the price going up versus the price going down based on the trading activity.
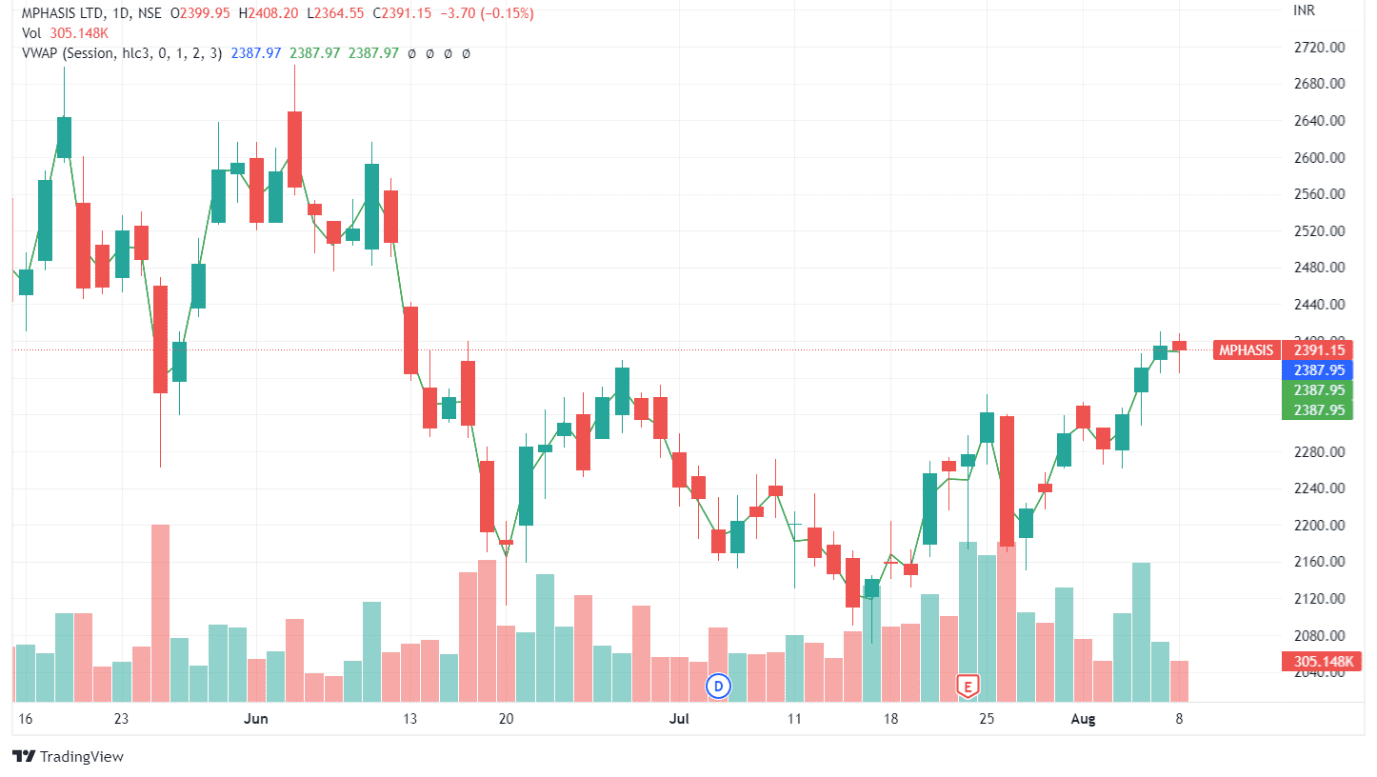
What is a candlestick pattern? How to read them?
A candlestick is a method of displaying information about the price movement of an asset. Candlestick charts are a popular component of technical analysis because they allow traders to perceive price information quickly and from only a few price bars.
This price data reflects the supply and demand of the security on the exchange and is represented by a candle representation
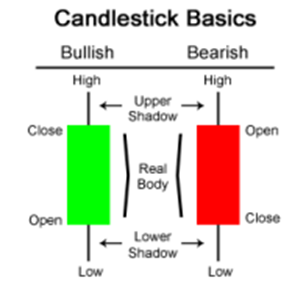
The body denotes the open-to-close range.
The wick, or shadow, indicates the high and low for the day.
The color that indicates the direction of market movement – A green (or white) body indicates an increase in price, while a red (or black) body indicates a decrease in price.
What are the types of Technical indicators?
• Trend spotting indicators include Moving Average systems, Bollinger Bands, Parabolic SAR, Commodity Channel Index, and ZigZag.
• Indicators of oscillation: MACD, RSI, RVI, Stochastic Oscillator, and William’s percent range
Volume indicators include volumes, on-balance volume, accumulation, and distribution.
What are the types of patterns?
- Western Classical Patterns
- Bearish Implications- Head and shoulder, Double top, Triple top, Rounding top, Rising Wedge.
- Bullish Implications- Inverse head and shoulder, Double bottom, Triple Bottom, Rounding bottom, Falling Wedge
- Continuation Patterns
- Triangles
- Flags
- Pennant
- Gaps
- Common gap
- Breakaway gap
- Runway gap
- Exhaustion gap
Rules for validating the pattern:
There are a few requisites to ensure whatever is visible on the charts is in line with what goals we have set with respect to the trade.
- Existence of a prior trend
- Breach of a trendline
- Implication of the height and width of the pattern
- Implication of volumes
Major indicators and oscillators:
Major indicators and oscillators are technical analysis tools that help identify trends and make trading decisions in the stock market.
Here are a few of the most popular indicators and oscillators:
Moving Averages: A trend-following indicator that smooths out price data by calculating the average price over a specified number of periods. The 50-day, 100-day, and 200-day moving averages are the most commonly used.
Bollinger Bands: A volatility indicator comprised of a moving average and two standard deviation lines. The bands expand when the price is volatile, and contract when the price is stable.
The Relative Strength Index (RSI) is an oscillator that compares gains and losses over a given time period to determine the strength of a stock’s price action. A reading of 70 or higher indicates that a stock is overbought, while a reading of 30 or lower indicates that it is oversold.
Stochastic Oscillator: This is a momentum indicator that compares a stock’s closing price to its price range over a predetermined number of periods. It’s frequently used to spot overbought or oversold conditions.
MACD (Moving Average Convergence Divergence): This is a trend-following momentum indicator that computes and plots the difference between two moving averages as a histogram.
Fibonacci Retracements: A technical analysis tool that employs horizontal lines to indicate areas of support or resistance at the key levels before the price resumes its original direction
Limitations of Technical analysis:
Some analysts and academic researchers believe that the EMH demonstrates why they should not expect any actionable information from historical price and volume data; however, by the same logic, business fundamentals should not provide any actionable information. These perspectives are known as the EMH’s weak and semi-strong forms.
Another criticism leveled at technical analysis is that history does not repeat itself exactly, so price pattern analysis is of questionable value and should be avoided. Prices appear to be better modeled when a random walk is assumed.
A third criticism of technical analysis is that it only works in some cases because it is self-fulfilling.
Many technical traders, for example, will place a stop-loss order below a company’s 200-day moving average.
If a large number of traders have done so and the stock reaches this price, there will be a large number of sell orders, causing the stock to fall, and confirming the expected movement.
Then, as the price falls, other traders will sell their positions, reinforcing the strength of the trend.
This short-term selling pressure is self-fulfilling, but it has little bearing on where the asset’s price will be in weeks or months.
To summarise Technical analysis of stocks, if enough users use the same signals, they may cause the movement predicted by the signal, but this small group of traders cannot drive the price in the long run.