In this article, we’ll explore the top trading best indicators. That can help boost your success in the market.Trading in financial markets can be a profitable and exciting venture, but it can also be challenging and risky. That’s why many traders turn to technical analysis. And which involves analyzing price charts and using various trading best indicators to make more informed trading decisions.
Moving Averages
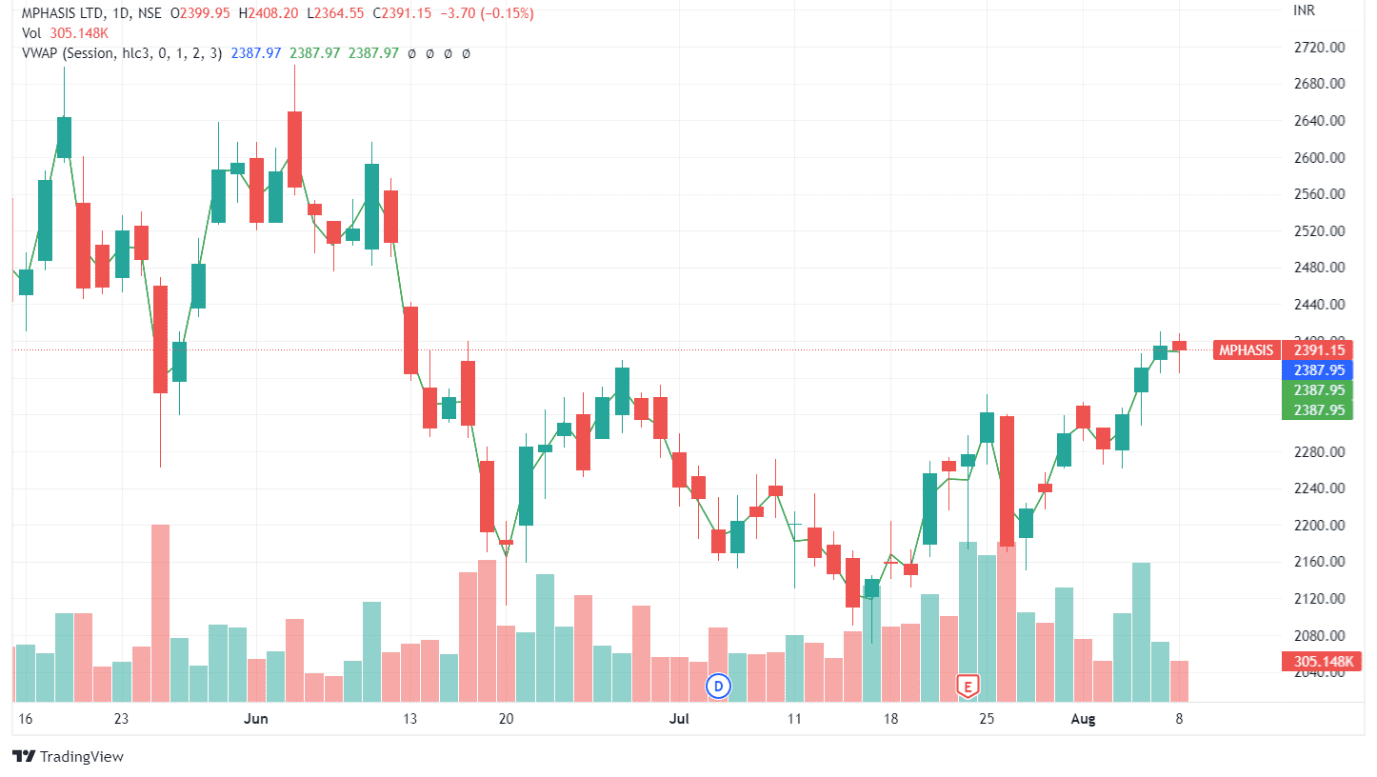
Moving averages are one of the most popular and widely used trading indicators. They help identify the trend of the market by smoothing out price fluctuations over a certain period. Traders use different time frames, such as the 50-day, 100-day, or 200-day moving averages, to spot trends and make trading decisions.
Relative Strength Index (RSI)
The RSI is a momentum indicator that measures the strength of a market’s trend. It oscillates between 0 and 100 and is typically used to identify overbought and oversold conditions in a market. A reading above 70 indicates overbought conditions, while a reading below 30 indicates oversold conditions.
Bollinger Bands
Bollinger Bands are volatility indicators that consist of a moving average and two standard deviations plotted above and below the moving average. They help traders identify when a market is experiencing high or low volatility. When the bands are narrow, it indicates low volatility, while wide bands indicate high volatility.
Moving Average Convergence Divergence (MACD)
The MACD is a trend-following momentum indicator that measures the relationship between two moving averages. It consists of a MACD line, a signal line, and a histogram. Traders use the MACD to identify changes in momentum and trend, as well as potential buy and sell signals.
Fibonacci Retracement
Fibonacci retracement is a technical analysis tool that uses horizontal lines to indicate areas of support or resistance at the key Fibonacci levels before a trend continues in the original direction. These levels are determined by drawing a trendline between two extreme points, usually high and low, and then dividing the vertical distance by the key Fibonacci ratios of 23.6%, 38.2%, 50%, 61.8%, and 100%.
Ichimoku Cloud
The Ichimoku Cloud is a comprehensive technical analysis tool that provides traders with several indicators on a single chart. It consists of five lines that help traders identify the trend, momentum, support and resistance levels, and potential buy and sell signals.
You may also like:
RSI Strategy Based Trends Indicator
Conclusion
Using technical analysis and trading indicators can significantly increase your success in the financial markets. However, it’s important to note that no trading indicator is perfect, and they should always be used in conjunction with other analysis and risk management techniques. By incorporating these top trading indicators into your trading strategy, you’ll be able to make more informed trading decisions and ultimately boost your success in the market.