If you’re an aspiring trader or looking to improve your trading skills, you’ve probably come across Trading View, a popular charting platform used by millions of traders worldwide. Trading View provides a plethora of technical analysis tools, including a vast array of indicators to help you make better trading decisions. In this article, we’ll take a comprehensive look at the Trading View Indicators list, their functions, and how they can help you make informed trading decisions.
List of Trading View Indicators:
Moving Averages (MA)
Moving averages are a popular indicator used to identify the trend of a stock or asset. It is the average price of a security over a specific period, and it helps traders to spot price movements and potential trend reversals.
Relative Strength Index (RSI)
The RSI is a momentum indicator that measures the strength of a security’s price action. It ranges from 0 to 100 and is used to identify overbought or oversold conditions of a stock or asset.
Bollinger Bands
Bollinger Bands are volatility bands placed above and below a moving average. They help traders to identify potential breakouts or breakdowns of a security by measuring volatility.
MACD (Moving Average Convergence Divergence)
The MACD is a trend-following momentum indicator that shows the relationship between two moving averages. It helps traders to identify potential trend reversals and spot buying or selling opportunities.
Fibonacci Retracement
The Fibonacci retracement tool is used to identify potential support and resistance levels based on the Fibonacci sequence, making it a valuable tool for technical analysts. It helps traders to determine the potential price movements of a stock or asset.
Ichimoku Cloud
The Ichimoku Cloud is a comprehensive technical analysis tool that provides multiple indicators, including moving averages, support and resistance levels, and momentum. It helps traders to identify potential trend reversals and determine potential buying or selling opportunities.
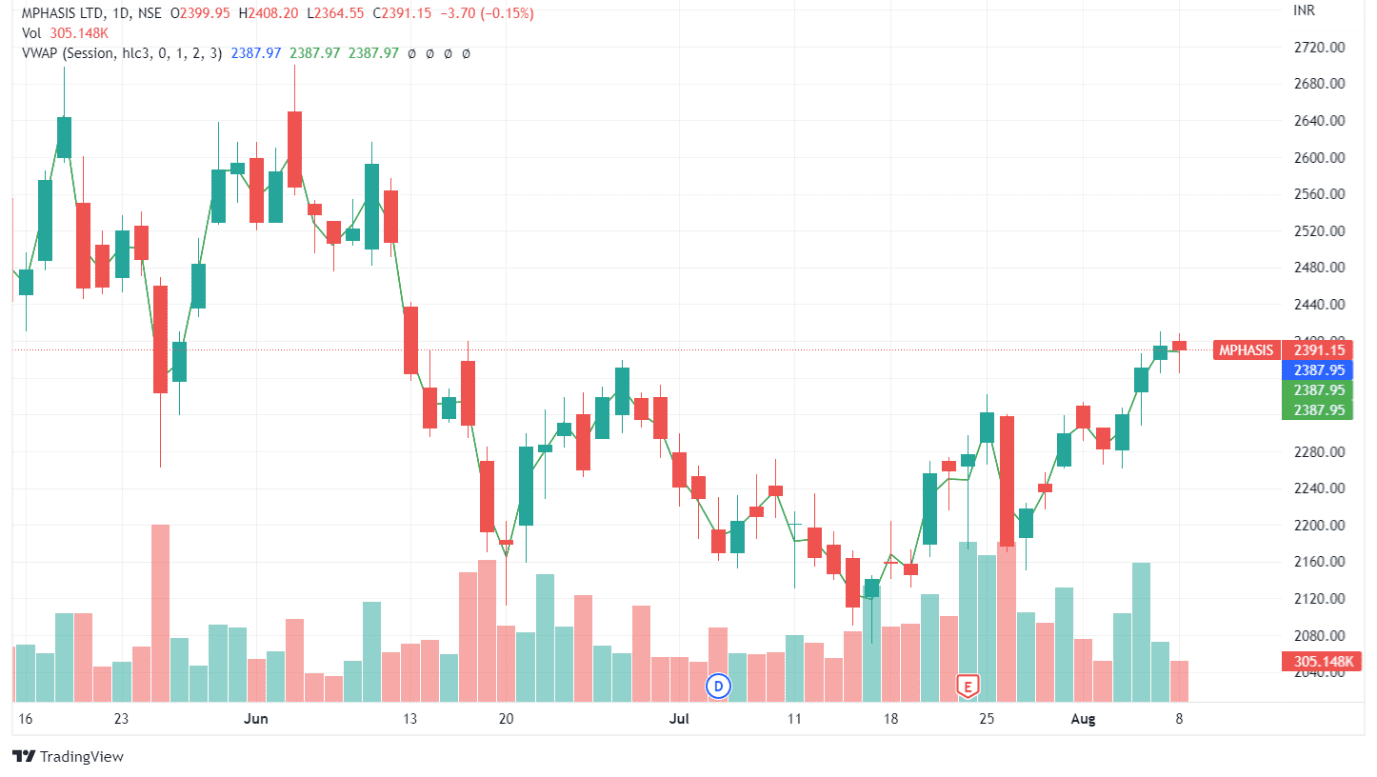
Volume
Volume shows the number of shares or contracts traded during a specific period and is a crucial indicator. It helps traders to determine the liquidity of a stock or asset and spot potential trend reversals.
You may also like:
Entry Exit – SMA Strategy Base Indicator
Conclusion
Trading View provides a wide range of technical indicators that can help traders make informed trading decisions. Understanding the functions of these indicators and how to use them to analyze the markets is crucial. By combining technical analysis with fundamental analysis and risk management, you can improve your chances of success as a trader.