In the world of financial markets, candlestick charts have become a popular tool for traders to analyze price movements. These charts provide valuable insights into market sentiment and can help make informed trading decisions. Whether you’re a beginner or an experienced trader, understanding how to read candlestick charts is essential for successful intraday trading.
Introduction
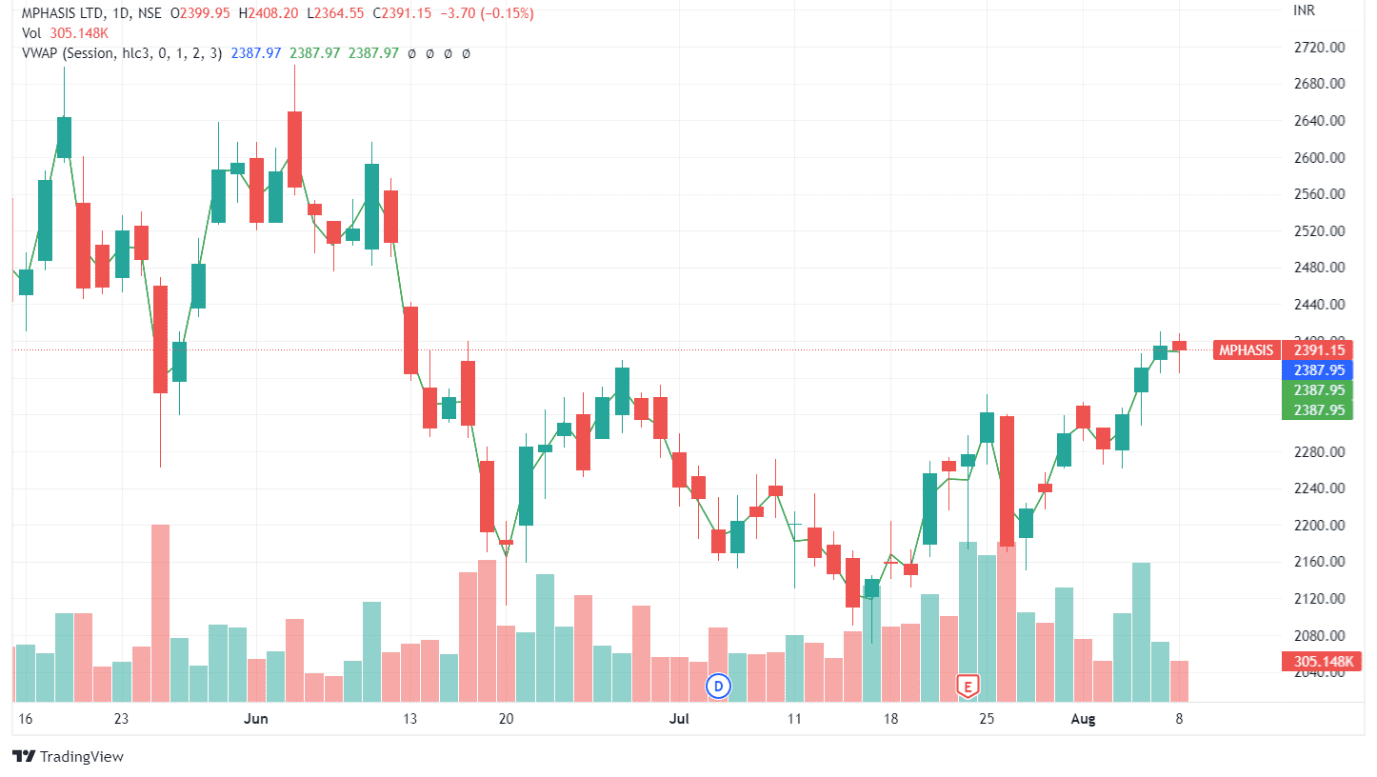
Candlestick charts are visual representations of price movements in the form of candle-like shapes. Each candlestick represents a specific time period, such as minutes, hours, or days, depending on the chosen chart timeframe. The body of the candlestick indicates the price range between the opening and closing prices, while the “wick” or “shadow” represents the high and low prices during that time period.
Candlestick charts are widely used in technical analysis due to their ability to provide detailed information about price action. They offer insights into market psychology and can indicate potential trend reversals, support and resistance levels, and market momentum.
Basics of Candlestick Charts
Before diving into the intricacies of reading candlestick charts, it’s essential to understand the basic components. A typical candlestick consists of:
The body: The rectangular area between the opening and closing prices. A filled (colored) body indicates a bearish candle, while a hollow (unfilled) body represents a bullish candle.
The wick or shadow: The thin lines above and below the body, indicating the high and low prices during the chosen time period.
Candlestick patterns can be categorized into different types, including doji, hammer, engulfing, harami, and many more. Each pattern carries its own interpretation and significance, providing valuable insights into market sentiment and potential price movements.
Reading Candlestick Patterns
To effectively read candlestick charts, it’s crucial to recognize and interpret various candlestick patterns. Here are some commonly observed patterns and their meanings:
Bearish Patterns
- Shooting star: A bearish reversal pattern characterized by a small body and a long upper shadow. It suggests a potential trend reversal, with selling pressure increasing.
- Bearish engulfing: This pattern is the opposite of the bullish engulfing pattern. It occurs when a small bullish candle is followed by a larger bearish candle that engulfs the previous candle. It indicates a potential shift towards bearishness.
Reversal Patterns
- Doji: A doji occurs when the opening and closing prices are very close or identical, resulting in a small or no body. It suggests indecision in the market and a potential trend reversal.
- Evening star: This three-candle pattern consists of a bullish candle, followed by a small-bodied or doji candle, and finally a bearish candle. It indicates a potential reversal from an uptrend to a downtrend.
Continuation Patterns
- Bullish flag: This pattern occurs when there is a sharp price rise, followed by a brief consolidation phase in the form of a rectangular-shaped flag. It suggests a continuation of the previous bullish trend.
- Bearish flag: Similar to the bullish flag, the bearish flag pattern indicates a temporary pause or consolidation within a downtrend, signaling a potential continuation of the bearish movement.
Identifying Support and Resistance
Candlestick charts can also assist in identifying key support and resistance levels. Support levels are price levels at which buying pressure is expected to outweigh selling pressure, causing the price to bounce back up. On the other hand, resistance levels are price levels where selling pressure is anticipated to be stronger than buying pressure, causing the price to reverse or stall.
By analyzing the candlestick patterns formed around these support and resistance levels, traders can gain insights into potential breakout or reversal opportunities.
Candlestick Chart Indicators
While candlestick patterns provide valuable information on their own, combining them with technical indicators can enhance their effectiveness. Here are some commonly used indicators with candlestick charts:
Volume indicators
Volume indicators provide information about the amount of trading activity during a given period. By analyzing volume alongside candlestick patterns, traders can assess the strength of price movements and identify potential trend reversals or continuations.
Moving averages
Moving averages smooth out price data and provide a visual representation of the average price over a specific period. They can help identify trends and potential support/resistance levels when combined with candlestick analysis.
Relative Strength Index (RSI)
The RSI is a momentum oscillator that measures the speed and change of price movements. By monitoring the RSI alongside candlestick patterns, traders can identify overbought or oversold conditions and potential trend reversals.
Using Candlestick Charts in Intraday Trading
Now that you have a solid understanding of candlestick charts and their various components, let’s explore how to utilize them effectively in intraday trading:
- Setting up a trading strategy: Define your trading goals, risk tolerance, and preferred timeframes. Develop a trading strategy that incorporates candlestick analysis along with other technical indicators or tools.
- Entry and exit points: Use candlestick patterns to identify potential entry and exit points for your trades. Look for confirmation from other technical indicators or price action signals to increase the probability of successful trades.
- Risk management: Implement proper risk management techniques, such as setting stop-loss orders and determining position sizes based on your risk appetite. Candlestick charts can assist in identifying appropriate levels for stop-loss orders and profit targets.
Tips for Reading Candlestick Charts
To become proficient in reading candlestick charts, consider the following tips:
- Practice and observation: Regularly observe candlestick patterns and their corresponding price movements in real-time.
- Keep emotions in check: Avoid making impulsive trading decisions based solely on candlestick patterns. Always analyze other factors, such as market trends, news events, and fundamental analysis, to validate your trading decisions.
- Combine with other technical analysis tools: While candlestick charts provide valuable insights, it’s beneficial to use them in conjunction with other technical analysis tools, such as trendlines, oscillators, or chart patterns. This multi-dimensional approach can provide a more comprehensive view of the market.
- Engage the reader: Reading candlestick charts may seem daunting at first, but with practice, it becomes easier to interpret the patterns and make informed trading decisions. Remember that mastery comes with time and experience.
Common Mistakes to Avoid
To avoid pitfalls in reading candlestick charts, be mindful of the following common mistakes:
- Over Reliance on candlestick patterns: While candlestick patterns offer valuable information, they should not be the sole basis for making trading decisions. Always consider other technical analysis tools and fundamental factors for a holistic view.
- Neglecting other factors: Candlestick patterns should be used in conjunction with other forms of analysis, such as trend analysis, volume analysis, and market sentiment. Ignoring these factors can lead to inaccurate interpretations and poor trading decisions.
- Lack of proper risk management: It’s crucial to implement risk management strategies, such as setting stop-loss orders and position sizing, to protect your capital. Failing to do so can result in significant losses, regardless of the accuracy of your candlestick analysis.
Conclusion
Reading candlestick charts is a valuable skill for intraday traders, providing insights into market sentiment, trend reversals, and potential support/resistance levels. By understanding the basics of candlestick charts, recognizing different patterns, and combining them with technical indicators, traders can make more informed decisions and improve their trading outcomes.
Remember, practice and observation are key to mastering the art of reading candlestick charts. Continuously learn and refine your skills, adapt to changing market conditions, and stay disciplined in your trading approach.