Intraday trading, also known as day trading, involves buying and selling financial instruments within the same trading day to take advantage of short-term price fluctuations. Successful intraday traders rely on various technical analysis tools to make informed trading decisions. One such tool that has gained popularity among traders is Fibonacci retracement. In this article, we will explore how Fibonacci retracement can be used to enhance intraday trading strategies and increase the chances of profitable trades.
Introduction to Intraday Trading
Intraday trading is a trading style that requires quick decision-making and active participation in the financial markets. Unlike long-term investing, where positions are held for weeks, months, or even years, intraday traders aim to capitalize on short-term price movements.
What is Fibonacci Retracement?
It is a technical analysis tool based on the Fibonacci sequence, a mathematical pattern discovered by Leonardo Fibonacci in the 13th century. The Fibonacci sequence is a series of numbers where each number is the sum of the two preceding ones: 0, 1, 1, 2, 3, 5, 8, 13, 21, and so on.
Understanding Fibonacci Levels
The Golden Ratio
The key concept behind Fibonacci retracement is the golden ratio, which is approximately 1.618. This ratio appears in various natural and man-made phenomena and is believed to have aesthetic and mathematical significance.
Fibonacci Retracement Levels
It specific percentages derived from the Fibonacci sequence are used as potential support and resistance levels. The most commonly used retracement levels are 23.6%, 38.2%, 50%, 61.8%, and 78.6%.
How to Use Fibonacci Retracement in Intraday Trading
Identifying the Trend
Before applying Fibonacci retracement, it is crucial to identify the prevailing trend in the market. The trend can be upward (bullish), downward (bearish), or sideways (consolidation).
Finding the Swing High and Swing Low
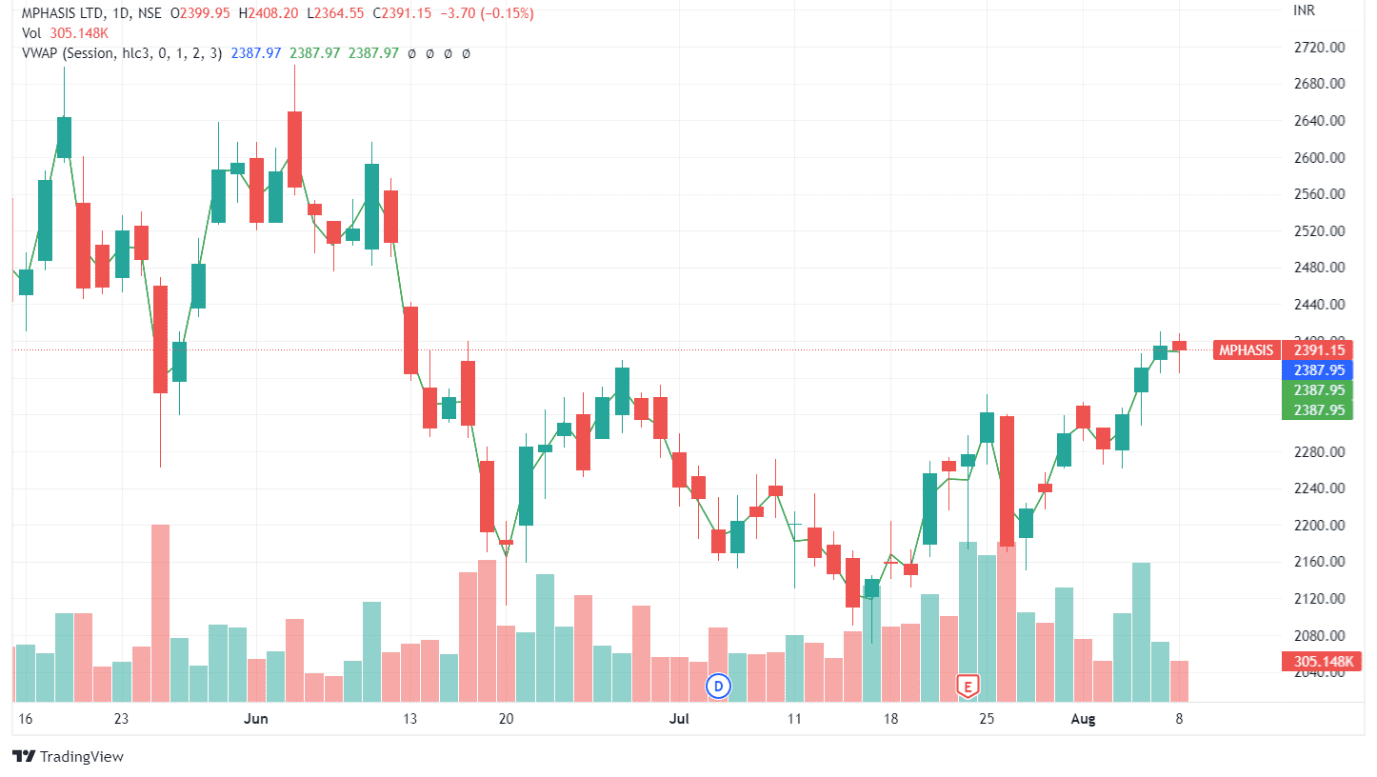
To plot Fibonacci retracement levels, we need to identify the swing high and swing low points in the price chart. The swing high is the highest point reached before a price decline, while the swing low is the lowest point before a price increase.
Plotting Fibonacci Levels
Once the swing high and swing low points are identified, the Fibonacci retracement levels can be plotted on the price chart. Traders look for potential reversals or price reactions near the Fibonacci levels, which act as support and resistance areas.
Analyzing Price Reversals and Breakouts
Intraday traders use Fibonacci retracement levels to analyze price reversals and breakouts. When the price approaches a Fibonacci level, it may either bounce off or break through the level, indicating a potential change in market sentiment.
Fibonacci Retracement Strategies for Intraday Trading
Fibonacci Confluence Zones
It occur when multiple Fibonacci retracement levels align closely together. These zones act as strong support or resistance areas, increasing the probability of price reversals.
Fibonacci Extensions
In addition to retracement levels, traders can utilize Fibonacci extensions to identify potential profit targets. Fibonacci extensions calculate projected future price levels based on the Fibonacci sequence, providing insights into where the price may potentially reach after undergoing a retracement.
Combining Fibonacci with Other Indicators
To enhance the accuracy of intraday trading strategies, it can be combined with other technical indicators such as moving averages, oscillators, or trend lines. This integration provides a more comprehensive analysis of the market dynamics.
Risk Management and Stop Loss in Intraday Trading
Successful intraday trading requires effective risk management. Traders should determine their risk tolerance and set appropriate stop loss levels to limit potential losses. It can help in determining strategic stop loss points based on key support or resistance areas.
Examples and Case Studies
To illustrate the practical application of Fibonacci retracement in intraday trading, let’s explore a few examples and case studies. We will analyze real-life price charts and demonstrate how Fibonacci retracement can be used to identify potential entry and exit points.
Advantages and Limitations of Fibonacci Retracement
It offers several advantages for intraday traders. It provides objective levels of support and resistance based on mathematical calculations. Additionally, it can be easily applied to any financial instrument and time frame.
However, it is important to note the limitations. Similar to other technical analysis tools, it is not foolproof and traders should use it in conjunction with other indicators to make well-informed trading decisions. Moreover, its effectiveness may vary in different market conditions and timeframes.
Common Mistakes to Avoid
Intraday traders often make certain mistakes. These include overusing the tool, not considering the overall market context, and neglecting to incorporate risk management strategies. Understanding these common mistakes can help traders make more informed decisions.
Conclusion
It is a valuable tool for intraday traders seeking to improve their trading strategies. By understanding the concepts of Fibonacci levels, trend identification, and price analysis, traders can effectively use and identify potential entry and exit points, manage risk, and enhance profitability.
Incorporating Fibonacci retracement into intraday trading requires practice, observation, and continuous learning. By combining this powerful tool with sound risk management techniques and other indicators, traders can increase their chances of success in the dynamic world of intraday trading.