Are you interested in intraday trading and want to improve your trading strategies? Look no further than candlestick charts. Candlestick charts are a popular and effective tool for technical analysis in the stock market. They provide valuable insights into price movements and help traders make informed decisions. In this article, we will explore the world of intraday trading with candlestick charts and discuss how you can leverage them to enhance your trading success.
Introduction
Intraday trading, also known as day trading, involves buying and selling financial instruments within the same trading day. It requires swift decision-making, precise timing, and a deep understanding of market dynamics. Candlestick charts, developed in Japan several centuries ago, have become a go-to resource for traders worldwide. These charts display the price movement of an asset within a specific time frame using candlestick-shaped data points.
What are Candlestick Charts?
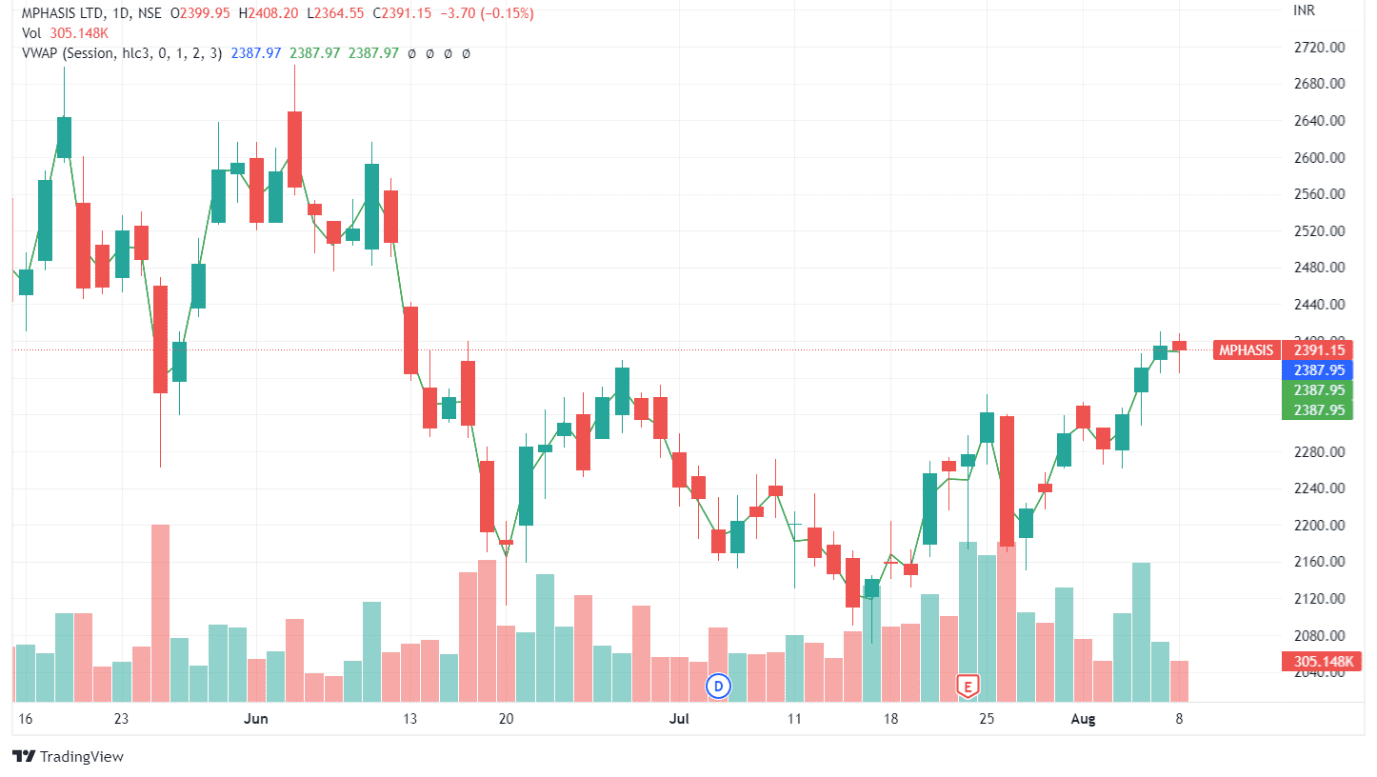
Candlestick charts represent price data visually, making it easier to identify patterns and trends. Each candlestick on the chart represents a specific time period, such as minutes, hours, or days, depending on the trader’s preference. The body of the candlestick represents the price range between the opening and closing prices, while the “wick” or “shadow” indicates the high and low prices during that time period.
Understanding Intraday Trading
Before diving into candlestick charts, it’s crucial to grasp the fundamentals of intraday trading. Intraday traders aim to profit from short-term price fluctuations, capitalizing on small price movements. They typically use technical analysis tools and indicators to identify potential entry and exit points for trades.
Importance of Candlestick Charts in Intraday Trading
Candlestick charts offer several advantages for intraday traders. Firstly, they provide a visual representation of market sentiment and price action, enabling traders to quickly interpret market trends.
Types of Candlestick Patterns
Candlestick patterns play a crucial role in analyzing price movements and predicting market trends. Here are some common types of candlestick patterns that traders frequently encounter:
- Bullish Candlestick Patterns
- Hammer: This pattern has a small body with a long lower shadow, indicating a potential reversal from a downtrend.
- Bullish Engulfing: It occurs when a small bearish candlestick is followed by a larger bullish candlestick that engulfs the previous one, suggesting a bullish reversal.
- Bearish Candlestick Patterns
- Shooting Star: It has a small body with a long upper shadow, indicating a potential reversal from an uptrend.
- Bearish Engulfing: It occurs when a small bullish candlestick is followed by a larger bearish candlestick that engulfs the previous one, suggesting a bearish reversal.
- Reversal Candlestick Patterns
- Doji: It represents an indecisive market with an equal opening and closing price, indicating a potential trend reversal.
- Evening Star: It consists of three candlesticks—a large bullish candlestick, a small indecisive candlestick, and a large bearish candlestick. It signals a potential reversal from a bullish trend.
- Continuation Candlestick Patterns
- Bullish Harami: It occurs when a small bearish candlestick is followed by a larger bullish candlestick, suggesting the continuation of an uptrend.
- Bearish Harami: It occurs when a small bullish candlestick is followed by a larger bearish candlestick, suggesting the continuation of a downtrend.
Common Intraday Trading Strategies with Candlestick Charts
Successful intraday traders often rely on various candlestick chart-based strategies to make profitable trades. Here are a few commonly used strategies:
- Trend Reversal Strategy: Traders look for reversal patterns like hammers, shooting stars, or dojis to identify potential trend reversals and enter trades accordingly.
- Breakout Strategy: Traders wait for breakout patterns, such as bullish or bearish engulfing patterns, to occur and enter trades in the direction of the breakout.
- Support and Resistance Strategy: Traders identify key support and resistance levels on candlestick charts and enter trades when the price bounces off these levels.
- Moving Average Strategy: Traders combine candlestick patterns with moving averages to identify potential buy or sell signals. For example, a bullish engulfing pattern combined with a bullish crossover of moving averages may indicate a strong buying opportunity.
Setting Up Candlestick Charts for Intraday Trading
To effectively utilize candlestick charts for intraday trading, it’s important to set them up properly. Here’s a step-by-step guide:
- Choose a reliable trading platform or charting software that provides candlestick charting features.
- Select the desired time frame for your intraday trading strategy, such as 1-minute, 5-minute, or 15-minute intervals.
- Customize the chart to display candlestick patterns, including colors for bullish and bearish candles, shadows, and body sizes.
- Consider using additional technical indicators, such as moving averages or volume indicators, to enhance your analysis.
Entry and Exit Points
Determining entry and exit points is crucial for successful intraday trading. Candlestick charts can help in this regard by providing valuable signals. Here are some common approaches for identifying entry and exit points:
- Entry Points: Traders often enter trades when they observe specific candlestick patterns indicating potential reversals, breakouts, or bounces from support/resistance levels. Confirmation from other indicators or oscillators can further strengthen the entry signal.
- Exit Points: Traders use a variety of techniques to determine exit points, such as setting profit targets based on support/resistance levels, trailing stop-loss orders, or utilizing technical indicators to identify potential trend reversals.
Risk Management in Intraday Trading
Proper risk management is essential in intraday trading to protect capital and minimize losses. Here are some risk management practices to consider:
- Set a maximum acceptable loss per trade and stick to it.
- Use stop-loss orders to limit potential losses.
- Diversify your trades to reduce risk exposure.
- Avoid trading based on emotions or impulse decisions.
- Regularly review and adjust your risk management strategies as needed.
Tips for Successful Intraday Trading with Candlestick Charts
To improve your chances of success in intraday trading with candlestick charts, consider the following tips:
- Learn and practice: Gain a solid understanding of candlestick patterns, their interpretations, and various intraday trading strategies. Practice with paper trading or using a demo account before committing real capital.
- Be disciplined: Follow your trading plan, stick to your strategies, and avoid impulsive decisions driven by emotions or short-term market fluctuations.
- Manage your time: Intraday trading requires active monitoring of the markets. Dedicate sufficient time and attention to your trading activities to identify opportunities and make informed decisions.
- Stay updated: Keep yourself informed about market news, economic events, and corporate announcements that can impact the prices of the assets you trade.
- Maintain a trading journal: Keep a record of your trades, including entry and exit points, reasons for the trade, and lessons learned. This journal can help you analyze your performance, identify patterns, and improve your trading strategies over time.
Conclusion
Intraday trading with candlestick charts offers traders a powerful tool to analyze price movements, identify patterns, and make informed trading decisions. By understanding the various types of candlestick patterns and implementing effective intraday trading strategies, you can enhance your chances of success in the dynamic world of intraday trading.