Intraday trading, also known as day trading, is a popular strategy in the financial markets where traders open and close positions within the same trading day. To make informed decisions and increase the chances of success, traders rely on various tools, including intraday trading charts. These charts provide valuable insights into price movements, trends, and patterns, allowing traders to identify potential entry and exit points. In this article, we will explore how you can use intraday trading charts to enhance your trading strategies and achieve better results.
1. Understanding Intraday Trading Charts
Intraday trading charts are graphical representations of price data over a specified time frame. They display the opening, closing, high, and low prices for a particular trading session. By analyzing these charts, traders can gain insights into market dynamics and make informed decisions.
1.1 Types of Intraday Trading Charts
There are several types of intraday trading charts commonly used by traders. Let’s explore the three primary types:
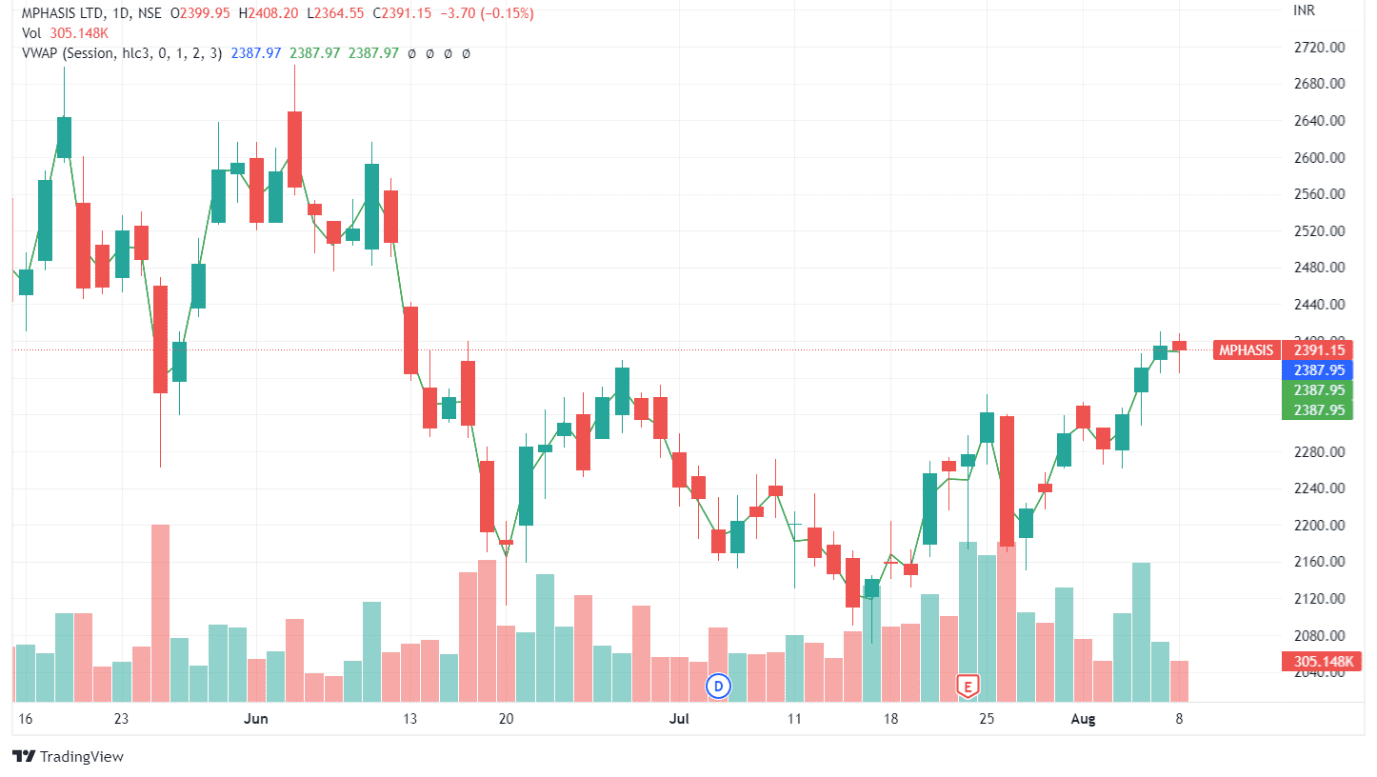
1.1.1 Candlestick Charts
Candlestick charts are widely popular among traders due to their ability to convey a wealth of information in a visually appealing manner. Each candlestick represents a specific time period, displaying the opening, closing, high, and low prices. The body of the candlestick is colored to indicate whether the price increased or decreased during that period.
1.1.2 Line Charts
Line charts are the simplest form of intraday trading charts. They connect the closing prices of each period, forming a continuous line. Line charts provide a clear representation of the overall price trend but lack the detailed information offered by candlestick or bar charts.
1.1.3 Bar Charts
Bar charts display price data using vertical lines. Each bar represents a specific time period and includes the opening, closing, high, and low prices. The top of the vertical line indicates the highest price, while the bottom represents the lowest price.
2. Importance of Intraday Trading Charts
Intraday trading charts play a crucial role in helping traders identify trading opportunities and make well-informed decisions. Here are some key reasons why they are important:
- Visual Representation: Intraday trading charts provide a visual representation of price movements, making it easier to interpret market trends and patterns.
- Timely Analysis: By analyzing intraday charts, traders can identify short-term trends and take advantage of intraday price fluctuations.
- Entry and Exit Points: Intraday charts help traders identify potential entry and exit points, allowing them to enter or exit positions at favorable prices.
- Risk Management: Charts assist in setting stop loss orders and determining risk levels based on support and resistance levels.
- Confirmation of Indicators: Intraday trading charts can validate signals from technical indicators, providing additional confidence in trading decisions.
3. Analyzing Price Patterns
One of the primary benefits of using intraday trading charts is the ability to identify and analyze price patterns. Here are some common techniques traders use for price pattern analysis:
3.1 Support and Resistance Levels
Support and resistance levels are key price levels where the market tends to pause, reverse, or accelerate. By identifying these levels on intraday charts, traders can anticipate potential price reactions and plan their trades accordingly.
3.2 Trend Lines
Trend lines are lines drawn on a chart to connect consecutive highs or lows. They provide a visual representation of the prevailing price trend. Traders use trend lines to identify potential entry and exit points, as well as to determine the strength of a trend.
3.3 Chart Patterns
Chart patterns, such as triangles, head and shoulders, and double tops/bottoms, offer valuable insights into market sentiment and potential trend reversals. Traders who can effectively identify these patterns on intraday charts can make more accurate predictions about future price movements.
4. Using Technical Indicators
In addition to price patterns, traders often use technical indicators to supplement their analysis. Here are a few commonly used technical indicators for intraday trading:
4.1 Moving Averages
Moving averages help smooth out price data and identify the overall trend direction. Traders use moving averages to identify potential entry or exit points when the price crosses above or below the moving average line.
4.2 Relative Strength Index (RSI)
The Relative Strength Index (RSI) is a momentum oscillator that measures the speed and change of price movements. Traders use RSI to identify overbought or oversold conditions, which can indicate potential reversals.
4.3 MACD (Moving Average Convergence Divergence)
MACD is a popular trend-following indicator that shows the relationship between two moving averages of a security’s price. Traders use MACD to identify potential trend reversals, bullish or bearish crossovers, and generate buy or sell signals.
5. Timeframes for Intraday Trading Charts
The choice of timeframe for intraday trading charts depends on individual trading strategies and preferences. Commonly used timeframes include 1-minute, 5-minute, 15-minute, and 30-minute charts. Traders can experiment with different timeframes to find the one that aligns best with their trading style.
6. Strategies for Intraday Trading
Successful intraday trading requires a well-defined strategy. Here are a few popular intraday trading strategies:
6.1 Breakout Trading
Breakout trading involves entering a trade when the price breaks out of a defined price range or chart pattern. Traders aim to capitalize on the momentum created by the breakout and profit from subsequent price movements.
6.2 Trend Following
Trend following strategies involve identifying and trading in the direction of the prevailing trend. Traders look for signs of trend continuation or reversal on intraday charts to enter or exit positions.
6.3 Reversal Trading
Reversal trading strategies focus on identifying potential trend reversals. Traders look for chart patterns or technical indicators signaling a trend change and enter positions accordingly.
6.4 Scalping
Scalping is a high-frequency trading strategy that aims to profit from small price movements. Traders using this strategy often rely on short-term intraday charts and execute multiple trades throughout the day.
7. Risk Management and Stop Loss Orders
Risk management is essential in intraday trading to protect capital and limit potential losses. Traders can use stop loss orders, placed below support or above resistance levels, to automatically exit a trade if the price moves against their position. It is crucial to determine risk tolerance and set appropriate stop loss levels before entering a trade.
8. Tips for Effective Use of Intraday Trading Charts
To make the most of intraday trading charts, consider the following tips:
8.1 Keep it Simple
Avoid cluttering your charts with too many indicators or information. Stick to a few key indicators and focus on clear and relevant price patterns.
8.2 Validate with Multiple Indicators
Use multiple indicators to confirm signals and increase the reliability of your analysis. Combining different indicators can provide a more comprehensive view of the market.
8.3 Practice and Backtesting
Before implementing your strategies with real money, practice on a demo account and backtest your approach using historical price data. This will help you refine your strategy and gain confidence in your trading decisions.
Conclusion
Intraday trading charts are invaluable tools for traders looking to improve their trades. By understanding different chart types, analyzing price patterns, utilizing technical indicators, and implementing effective strategies, traders can enhance their decision-making process and increase the likelihood of successful trades.